Trading Strategies Revealed – “Inside Bar” review

Trend reversal trading strategy “Inside Bar” is designed mainly for Forex and can be used on all currency pairs on any time frames. Its rules state that:
What is the “Inside Bar”
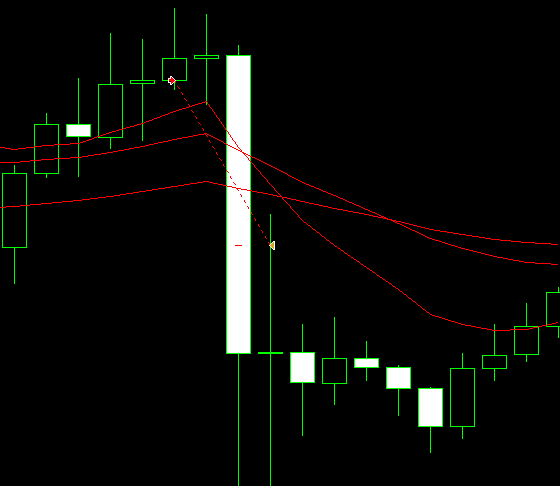
An “inside bar” pattern is a two-bar price action trading strategy in which the inside bar is smaller and within the high to low range of the prior bar, i.e. the high is lower than the previous bar’s high, and the low is higher than the previous bar’s low.

How to trade “Inside Bar”
A trader buy order upon an Inside Bar pattern during a downtrend. A sell order should be placed upon Inside Bar pattern during an uptrend.
Initial back-test
To run a back-test we have coded a complete Inside Bar trading strategy as a MetaTrader 4 Expert Advisor. During preliminary analysis we have identified that the best time frame for Inside Bar trading strategy is 1 hour (H1). We have run a back-test of Inside Bar trading strategy. For our test as a trade exit rule we have used a Trailing Stop of 30 pips which is launched after a trade has started and is modified each new 1 pip of profit. From our point of view, such approach allows to maximize profit and minimize drawdown.
We have run the test for 2010.01.01-2020.01.01 using Every Tick modelling on EURUSD-H1, using 1:1 leverage, without reinvestment, assuming spread equals 10 ticks. These are the main parameters of Inside Bar trading strategy performance at its non-optimized state:
| ROI | # of trades | Winning ratio | Max. drawdown |
| -9.89% | 7629 | 34.62% | 98.98% |
Trading data analysis
After running the initial test of a simple non-filtered strategy we perform a trading data analysis that allows to identify possible filters to use to make the strategy more profitable reducing the drawdown simultaneously.
The following charts may give some possible insights on which filters to apply (time sessions, day of week limitation, trend strength threshold, overbought/oversold conditions, volatility range) to turn this strategy profitable should you decide to use this strategy in your investment portfolio:
Optimization
Inside Bar can be used with other indicators to filter out losing trades and make entry signals more accurate. After analysing trading data we have found the following insights which have helped us to make the Inside Bar trading strategy profitable reducing it’s drawdown in 20 times:
- Trades that were opened at a too low and at a too high value of ADX have appeared to bring more losses when trading “Inside Bar” trading strategy during 2010 – 2020. ADX shows the power of the current trend. It is more reasonable to take trades at a more stable trend.
(ROI increase -9.8% ->4.2 %, Drawdown reduction 98. 98% ->24%) - The majority of buy trades that were opened at a too low value of Stochastic and the majority of sell trades that were opened at a too high value of Stochastic were losing when trading “Inside Bar” trading strategy during 2010 – 2020. It is risky to take trades in the overbought and oversold zones.
(ROI increase -9.8% ->1.7 %, Drawdown reduction 98. 98% ->23.58%) - Most of the buy trades that were opened at a too high value of CCI were losing when trading “Inside Bar” trading strategy during 2010 – 2020. Traders often use CCI on the longer-term chart to identify the major trend and on the shorter-term chart to isolate pullbacks and generate trade signals.
(ROI increase -9.8% ->-5.5 %, Drawdown reduction 98. 98% ->74.3%) - Most of the sell trades that were opened at a too high value of Williams Percent Range indicator were losing when trading “Inside Bar” trading strategy during 2010 – 2020. Williams Percent Range is a momentum-kind indicator and measures overbought and oversold levels.
(ROI increase -9.8% -> -6.5 %, Drawdown reduction 98.98% ->86.8%)
Optimization results
We have analysed data received from a test of Inside Bar trading strategy during 2010 — 2020 years and applied some filters such as Stochastic, Williams Percent Rangeand, CCI and ADX. As a result, the profitability of the strategy has increased from -98.89% up to 63.82% and it’s drawdown has reduced from 98.98% to 4.74% using leverage 1:1.
Post-optimization back-test
Reducing the drawdown has allowed us to increase the leverage that can be used while trading this strategy up to 1:30, which in turn, has resulted in annualized ROI increase up to 19.29%!
Reducing the drawdown has also allowed us to use risk based lot calculation. Below you can see the back-test results using $10,000 initial balance and 10% risk per trade:
| ROI | # of trades | Winning ratio | Max. drawdown |
| 33807.74% | 1206 | 41.29% | 24.28% |


Analyze your trading strategy!
If you have a trading strategy that you want to analyse, optimize and increase its profitability (or even turn it from losing into a profitable Forex trading strategy) – feel free to contact us! Our trading data analysis team will respond to you within 24 hours clarifying all the details needed.
Custom Programming

Our company specializes on automated trading systems and trading indicators development for the most popular trading platforms, such as MetaTrader 4/5, NinjaTrader 7/8, TradingView, TradeStation and cTrader.
If you need your own automated trading software designed based on your individual requirements, make a request for a free consultation with our team of professional programmers and find out the cost and terms of your project development. Disclaimer: Hypothetical or Simulated performance results have certain limitations, unlike an actual performance record, simulated results do not represent actual trading. Also, since the trades have not been executed, the results may have under-or-over compensated for the impact, if any, of certain market factors, such as lack of liquidity.
Simulated trading programs in general are also subject to the fact that they are designed with the benefit of hindsight. No representation is being made that any account will or is likely to achieve profit or losses similar to those shown.
Past performance is not necessarily indicative of future results. The customer is responsible for using the product at his or her own risk and “Nordman Algorithms” is not responsible for any possible losses caused by use of the product, including but not limited to losses.


Comments (4)
Vikopoadvisor
My experience is very stronger because of this learning especially Leadership, I am able to put it into practice also with other skills i have will improve good to do my work. Solved all my problems in a pressing time! Excited to see the other themes they make!
Vikopoadvisor
My experience is very stronger because of this learning especially Leadership, I am able to put it into practice also with other skills i have will improve good to do my work. Solved all my problems in a pressing time! Excited to see the other themes they make!
Vikopoadvisor
It Is an excellent Experience.. I can definitely relate to few things that i can do better like Delegate, Monkey off my back etc…
Vikopoadvisor
It Is an excellent Experience.. I can definitely relate to few things that i can do better like Delegate, Monkey off my back etc…